
Type of Commodity
Beef demand per each region depends on Population, Consumption Per Capita and Preferences. Beef demand in Indonesia will grow with the average growth rate of around = 4.93% / year as seen in this following graph:
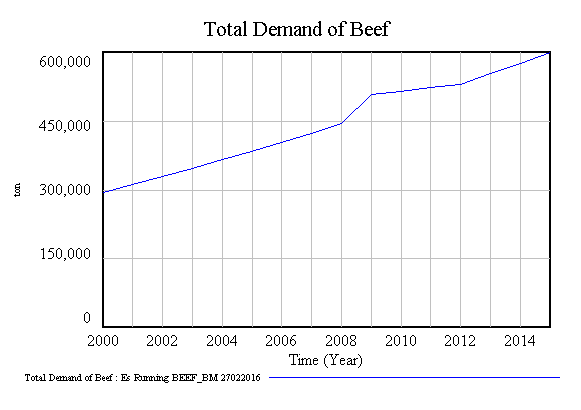
| Year | Beef Demand Projection (Tons) |
|---|---|
| 2016 | 623532 |
| 2017 | 648456 |
| 2018 | 674330 |
| 2019 | 700644 |
| 2020 | 727206 |
| 2021 | 754516 |
| 2022 | 782225 |
| 2023 | 810786 |
| 2024 | 839661 |
| 2025 | 869453 |
| 2026 | 900008 |
| 2027 | 931367 |
| 2028 | 962913 |
| 2029 | 995761 |
Soybean demand depends on food industri and non food industry demand. Soybean demand estimation for each type of food and nonfood industry in Indonesian can bee seen in this following table:
| No | Year | Fresh Soybean (Ton) | Tofu (Ton) | Tempe (Ton) | Tauco (Ton) | Oncom (Ton) | Soy Sauce (Ton) | Non Food Industry (Ton) | Seed Material (Ton) | Feed Demand (Ton) |
| 1 | 2000 | 9583 | 861941 | 927985 | 6868 | 10791 | 116041 | 141174 | 140075 | 22449 |
| 2 | 2001 | 11296 | 653938 | 670030 | 6822 | 10805 | 117747 | 140234 | 140642 | 4852 |
| 3 | 2002 | 12427 | 828475 | 812926 | 6519 | 11217 | 138987 | 140830 | 141327 | 4825 |
| 4 | 2003 | 10064 | 902030 | 835392 | 6835 | 11468 | 162324 | 141197 | 140961 | 4535 |
| 5 | 2004 | 10580 | 695583 | 708708 | 7353 | 11424 | 163258 | 149814 | 139986 | 3609 |
| 6 | 2005 | 8725 | 614683 | 909051 | 7174 | 11178 | 175279 | 140209 | 139071 | 4923 |
| 7 | 2006 | 9725 | 781422 | 1002053 | 7328 | 11981 | 127570 | 151270 | 140490 | 4955 |
| 8 | 2007 | 11416 | 801990 | 766889 | 7455 | 12494 | 155946 | 167378 | 140563 | 2576 |
| 9 | 2008 | 9165 | 856131 | 806945 | 6921 | 12688 | 142089 | 150368 | 151278 | 4962 |
| 10 | 2009 | 10568 | 909976 | 955284 | 7863 | 11715 | 164627 | 141580 | 141384 | 3880 |
| 11 | 2010 | 11070 | 954855 | 761559 | 7709 | 12852 | 135050 | 141285 | 141120 | 4056 |
| 12 | 2011 | 9889 | 1077767 | 887937 | 7667 | 12227 | 122110 | 79778 | 140830 | 3661 |
| 13 | 2012 | 13859 | 1030681 | 753819 | 7984 | 12396 | 126453 | 131360 | 140584 | 3673 |
| 14 | 2013 | 11852 | 1086548 | 838733 | 7947 | 12612 | 184905 | 131463 | 131277 | 131230 |
| 15 | 2014 | 11141 | 632408 | 868754 | 7585 | 12722 | 127835 | 148268 | 131120 | 131461 |
| 16 | 2015 | 16172 | 816976 | 1053926 | 8791 | 13302 | 193664 | 131019 | 163653 | 131295 |
| Year | Soybean Demand Projection in Indonesia (Tons) |
|---|---|
| 2016 | 2698910 |
| 2017 | 2561558 |
| 2018 | 2720182 |
| 2019 | 2344655 |
| 2020 | 2510840 |
| 2021 | 2628263 |
| 2022 | 3085795 |
| 2023 | 2955884 |
| 2024 | 2592703 |
| 2025 | 2720942 |
| 2026 | 2778336 |
| 2027 | 3137082 |
| 2028 | 2942217 |
| 2029 | 3270206 |
Milk demand in several areas in Indonesia can be seen in this following table:
| No | Year | Sumatera (Liter) | Java (Liter) | Bali & Nusa Tenggara (Liter) | Kalimantan (Liter) | Sulawesi (Liter) | Maluku & Papua (Liter) |
| 1 | 2000 | 212302 | 594868 | 54474 | 55547 | 73267 | 20645 |
| 2 | 2001 | 231831 | 647284 | 59497 | 60907 | 79944 | 23048 |
| 3 | 2002 | 253156 | 704320 | 64982 | 66785 | 87228 | 25730 |
| 4 | 2003 | 276443 | 766381 | 70973 | 73230 | 95177 | 28725 |
| 5 | 2004 | 301871 | 833911 | 77517 | 80296 | 103850 | 32068 |
| 6 | 2005 | 329639 | 907391 | 84664 | 88045 | 113314 | 35800 |
| 7 | 2006 | 359961 | 987345 | 92470 | 96541 | 123639 | 39967 |
| 8 | 2007 | 379081 | 1036107 | 97401 | 102090 | 130104 | 43030 |
| 9 | 2008 | 406318 | 1106616 | 104420 | 109877 | 139342 | 47153 |
| 10 | 2009 | 435513 | 1181923 | 111945 | 118259 | 149237 | 51670 |
| 11 | 2010 | 466804 | 1262355 | 120012 | 127280 | 159833 | 56620 |
| 12 | 2011 | 502265 | 1349992 | 129103 | 137325 | 171183 | 60999 |
| 13 | 2012 | 538985 | 1440188 | 138599 | 147818 | 183002 | 65543 |
| 14 | 2013 | 581160 | 1543731 | 149433 | 159779 | 196323 | 70796 |
| 15 | 2014 | 623796 | 1648188 | 160492 | 172160 | 210831 | 76118 |
| 16 | 2015 | 669446 | 1759773 | 172239 | 185396 | 226539 | 81843 |
| Year | National Milk Demand Projection (Tons) |
|---|---|
| 2016 | 3,418,702 |
| 2017 | 3,656,560 |
| 2018 | 3,912,229 |
| 2019 | 4,188,082 |
| 2020 | 4,481,467 |
| 2021 | 4,795,950 |
| 2022 | 5,135,179 |
| 2023 | 5,497,713 |
| 2024 | 5,882,856 |
| 2025 | 6,296,148 |
| 2026 | 6,739,317 |
| 2027 | 7,212,471 |
| 2028 | 7,717,851 |
| 2029 | 8,257,389 |
| 2030 | 8,833,367 |
Sugar Demand in Indonesia can be classfied into two categories, those are household and industry demand, as seen in this following table:
| No | Year | House Hold Demand | Industry Demand |
| 1 | 2000 | 1802756 | 1186415 |
| 2 | 2001 | 1932501 | 1218365 |
| 3 | 2002 | 2065628 | 1235180 |
| 4 | 2003 | 2202214 | 1098597 |
| 5 | 2004 | 2145444 | 1243364 |
| 6 | 2005 | 2086622 | 1353018 |
| 7 | 2006 | 2124566 | 1635434 |
| 8 | 2007 | 2163210 | 1596314 |
| 9 | 2008 | 2252285 | 1247715 |
| 10 | 2009 | 2343525 | 1956475 |
| 11 | 2010 | 2436981 | 2097519 |
| 12 | 2011 | 2536355 | 2102781 |
| 13 | 2012 | 2631924 | 2729002 |
| 14 | 2013 | 2730402 | 3164928 |
| 15 | 2014 | 2832990 | 2599252 |
| 16 | 2015 | 2894389 | 2716815 |
| Year | Sugar Household Demand Projection (Tons) | Sugar Industry Demand Projection (Tons) |
|---|---|---|
| 2016 | 2977439 | 2686565 |
| 2017 | 3069531 | 2763121 |
| 2018 | 3162644 | 2840216 |
| 2019 | 3259456 | 2920247 |
| 2020 | 3360471 | 3003640 |
| 2021 | 3464722 | 3089509 |
| 2022 | 3571824 | 3177491 |
| 2023 | 3683529 | 3269127 |
| 2024 | 3796545 | 3361472 |
| 2025 | 3914319 | 3457566 |
| 2026 | 4035519 | 3556207 |
| 2027 | 4158306 | 3655757 |
| 2028 | 4285468 | 3758655 |
| 2029 | 4417969 | 3865717 |
| 2030 | 4552850 | 3974332 |
Note: Research Results
For 2014, there are about 150 factories using cassava as raw material for production. Daily cassava needs vary between 200-1000 tons of cassava per day per plant.
The Central Statistics Agency (BPS), Indonesia still imports cassava, imports in March 2016 reached 987.5 tons of cassava. Import cassava majority imported from Vietnam.
Ministry of Industry noted corn demand in Indonesia reached 13.8 million tons in 2016. The need is divided into two parts, namely for the feed industry with total demand reached 8.6 million tons and for food with total demand reaching 5.2 million tons.
Director General of Agriculture Ministry of Industry, Panggah Susanto explained, corn demand in the next year will not vary much with the needs of maize this year. In the past year, corn demand reached 13.1 million tons. The amount is divided into two, namely for the feed of 8.3 million tonnes and for the consumption of food or the amount of 4.1 million tons.
"For 2016 increase. Feeding be 8.6 million tons, to reach 5.2 million tons of food," he said at the Coordinating Ministry for Economic Affairs, Jakarta, Thursday (10/11/2015).
Chili Consumption Per Capita (Kg/Kapita/Tahun)
| Year | Total Consumtion of Chili (KG/Kapita/Year) |
|---|---|
| 2003 | 1,58 |
| 2004 | 1,60 |
| 2005 | 1,75 |
| 2006 | 1,61 |
| 2007 | 1,77 |
Fertilizer Demand in Indonesia:
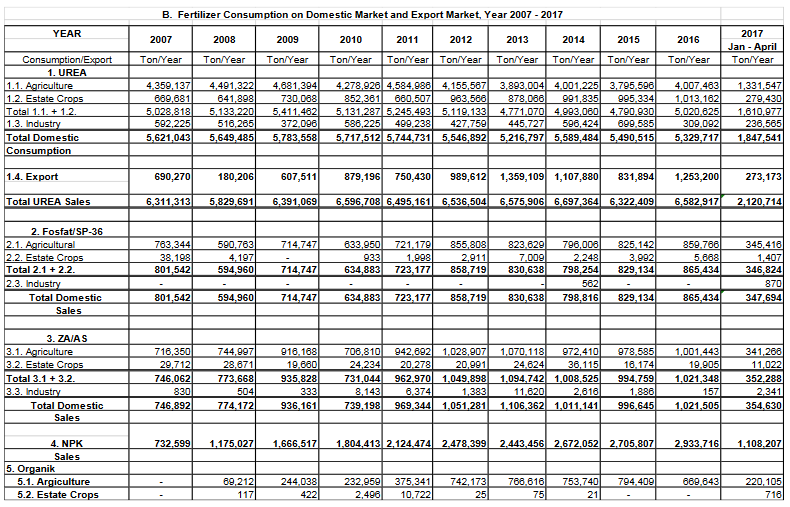
Source : Asosiasi Produsen Pupuk Indonesia (APPI, 2017)
Copyright © 2016 Designed by : Thinker Studio. All Rights Reserved.